Fibonacci theory

Price correction (retracement) is a short-term anti-trend price movement. Prices almost never just rise during the uptrend and fall during the downtrend. Even within the same trend, the price can rise and then retrace for a while or vice versa. The most profitable and less risky positions are positions opened at the end of the retracement. It is therefore important to know how to define the levels at which the trend will resume after a short retracement. Technical analysis has the so called correction index which uses Fibonacci numbers. The Fibonacci sequence is a series of numbers that takes the previous number and adds it to the current number to get the next number in the sequence. For example, 1, 1, 2, 3, 5, 8, 13, 21, 34, 55, 89, 144 etc.
These numbers possess an intriguing number of interrelationships, such as the fact that any given number is approximately 1.618 times the preceding number and any given number is approximately 0.618 times the following number.
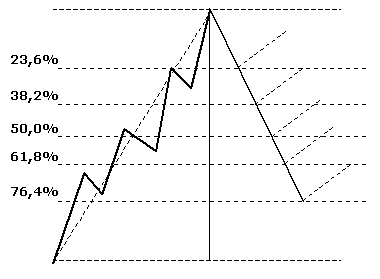
Experienced traders know that in a fast market, the correction is about 0.382 of the price range movement. In a market with average price movements, correction is about half the price range movement. Maximum correction is 0.618, which indicates that the trend is rather weak.
Zero percent is the considered as the peak of the crest of the move while hundred percent is considered as the bottom most point of the trough of the move. The trading signals are revealed by the Fibonacci retracement zones or levels which are calculated at 23.6%, 38.2% and 50%.
Since it's mostly seen that history is continuously repeated when it comes to the forex market, the Fibonacci methods prove be to be very applicable over here. Thus, with these shapes, the forex traders are not only able to predict the entire course of the market, they also end up preventing worthless investments.
